Tellus
https://www.tellusxdp.com/ja/
Result
 ASTER GDEM提供:METI and NASA
 ASTER GDEM提供:METI and NASA
 ASTER GDEM提供:METI and NASA
Code
import requests, json, math
from skimage import io
from io import BytesIO
import numpy as np
TOKEN = 'Enter your token'
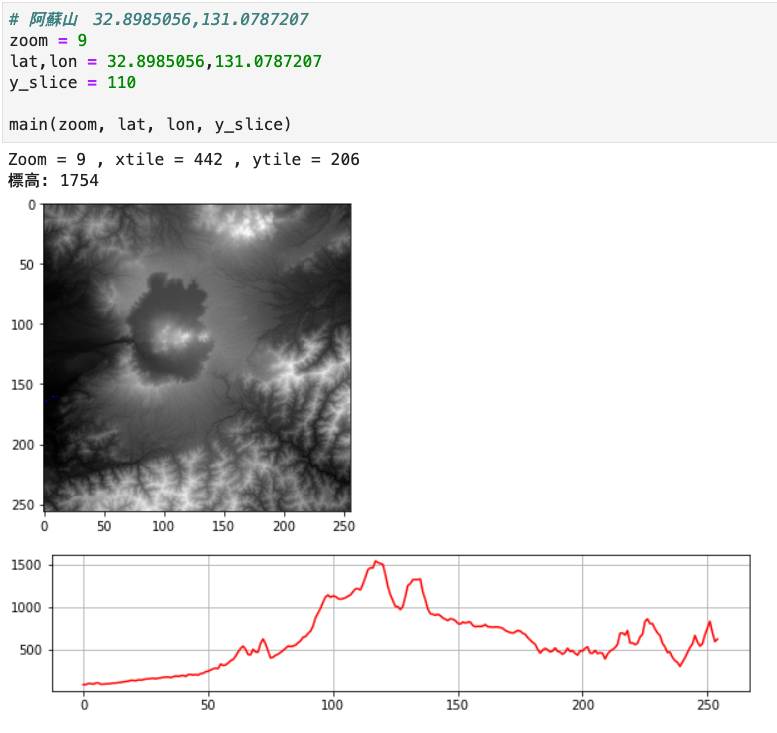
# 阿蘇山 32.8985056,131.0787207
# zoom = 9
# lat,lon = 32.8985056,131.0787207
# y_slice = 110
# 霧島山 31.9341693,130.8527772
# zoom = 9
# lat,lon = 31.9341693,130.8527772
# y_slice = 10
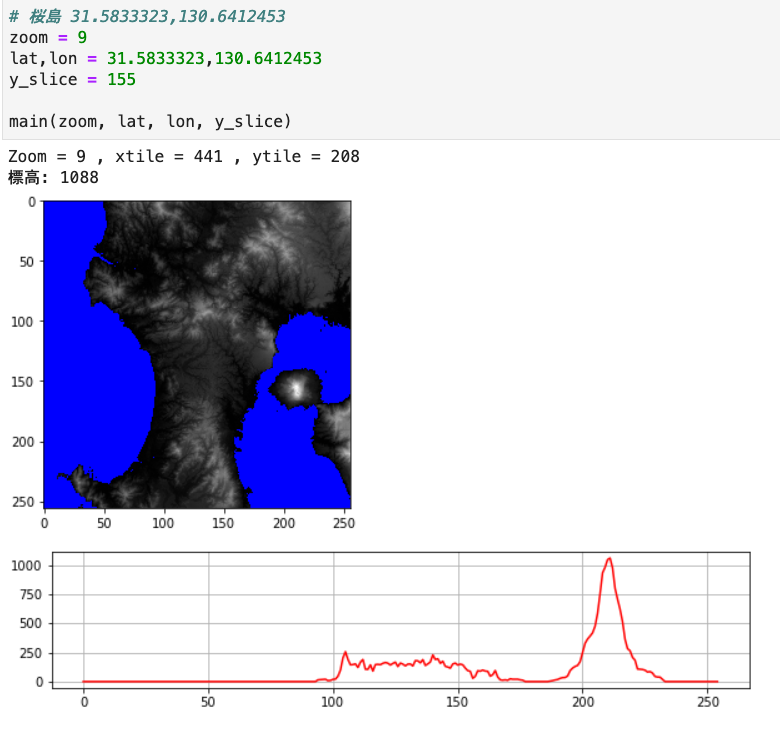
# 桜島 31.5833323,130.6412453
# zoom = 9
# lat,lon = 31.5833323,130.6412453
# y_slice = 155
# # イエローストーン 44.4122632,-110.7319387
# zoom = 8
# lat,lon = 44.4122632,-110.7319387
# y_slice = 110
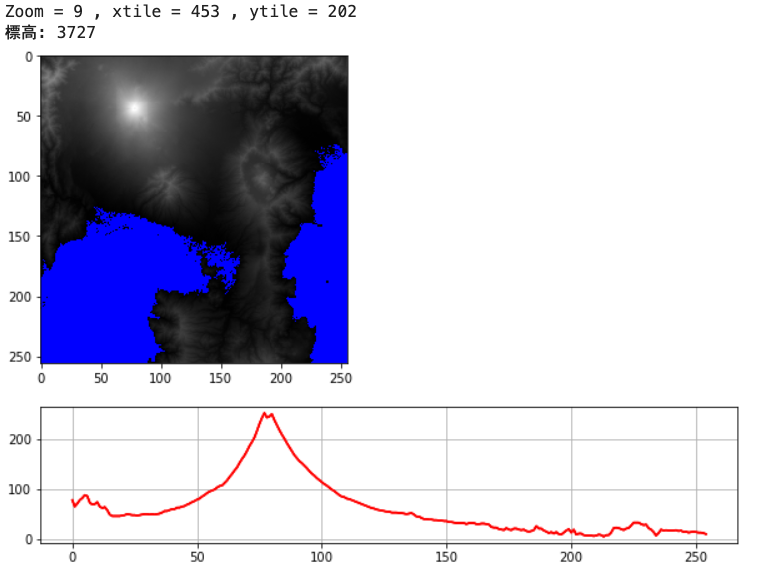
# 富士山 35.3586732,138.719563
zoom = 9
lat,lon = 35.3586732,138.719563
y_slice = 44
def get_tile_num(lat_deg, lon_deg, zoom):
# https://wiki.openstreetmap.org/wiki/Slippy_map_tilenames#Python
lat_rad = math.radians(lat_deg)
n = 2.0 ** zoom
xtile = int((lon_deg + 180.0) / 360.0 * n)
ytile = int((1.0 - math.log(math.tan(lat_rad) + (1 / math.cos(lat_rad))) / math.pi) / 2.0 * n)
print("Zoom =", zoom, ", xtile =", xtile, ", ytile =", ytile)
return (xtile, ytile)
def get_astergdem2_dsm(zoom, xtile, ytile):
"""
"""
url = " https://gisapi.tellusxdp.com/astergdem2/dsm/{}/{}/{}.png".format(zoom, xtile, ytile)
headers = {
"Authorization": "Bearer " + TOKEN
}
r = requests.get(url, headers=headers)
return io.imread(BytesIO(r.content))
def get_height_data(astergdem2_dsm):
R = 255 * 255 * (astergdem2_dsm[:,:,0].astype(np.uint32))
G = 255 * (astergdem2_dsm[:,:,1].astype(np.uint32))
B = (astergdem2_dsm[:,:,2].astype(np.uint32))
height = R + G + B
return height.astype(np.uint32)
def get_max_height(imgin):
max_height = np.max(imgin)
print("標高:", max_height)
return max_height
def get_height_img(imgin):
gray = imgin * 255.0 / get_max_height(imgin)
_img = np.zeros([256,256,3],np.uint8)
_img[:,:,0] = gray[:,:]
_img[:,:,1] = gray[:,:]
_img[:,:,2] = gray[:,:]
# 標高 0m をブルーで塗りつぶす
_img[:,:,2][_img[:,:,2] == 0] = 255
return _img.astype(np.uint8)
def get_height(zoom, lat,lon):
(xtile, ytile) = get_tile_num(lat,lon, zoom)
_astergdem2_dsm = get_astergdem2_dsm(zoom, xtile, ytile)
_height = get_height_data(_img)
return _height_data
def show_slice(height, y_slice):
'''
断面図を表示
'''
import matplotlib.pyplot as plt
plt.figure(figsize=(10, 2.0))
x = range(0,255)
# 断面の Y座標
plt.plot(x, height[y_slice, x].astype(np.float), label='mix', color='red')
plt.grid(True)
plt.show()
if __name__ == '__main__':
main(zoom, lat, lon, y_slice)
def main(zoom, lat, lon, y_slice):
(xtile, ytile) = get_tile_num(lat,lon, zoom)
astergdem2_dsm = get_astergdem2_dsm(zoom, xtile, ytile)
height_data = get_height_data(astergdem2_dsm)
height_img = get_height_img(height_data)
io.imshow(height_img)
show_slice(height_data, y_slice)